

Office Air Quality Explained: Standards, Health and Fixes
In 2024, only 35% of 1,994 indoor workers surveyed across the United States, Canada, France, the United Kingdom, Italy, and Germany described their workplace air as "very clean," according to Fellowes' Annual International Day of Clean Air Survey reported by ISSA. That gap between how an office looks and how its air feels is where facility managers should start. A clean desk tells you nothing about particles, gases, moisture, or whether outdoor air reaches the people breathing it.
What Office Air Quality Covers and Why It Matters
Think of the ventilation system as the office's lungs. A building that's breathing shallowly still looks fine from the doorway, but everyone inside gets a little more tired as the day wears on. Say a floor feels fresh at 9 a.m. and heavy by 3 p.m. The furniture hasn't changed; the air delivery, occupancy, and pollutant load have.
Office air quality is the condition of the air inside and around a building, including particles and gases, moisture, and how well outdoor air is delivered to occupants. The broader health picture behind that definition is covered in this guide to indoor air quality effects on health. You'll manage it better if you track three separate things instead of chasing one number.
Three Dimensions Worth Tracking
Measured pollutants: Fine particles, gases from materials and cleaning products, and moisture related contaminants that instruments or targeted tests can detect.
Delivered outdoor air: Not what the design drawing promises, but what reaches each occupied zone through dampers, ducts, and vents.
Occupant perception: Odour, stuffiness, temperature, noise, and whether people feel they have any control over their immediate space.
That third dimension isn't soft data. In a 2024 study of 105 municipal employees across 16 public office buildings in South Georgia, 54% considered their office air quality acceptable, while 34% reported respiratory irritation and 76.54% reported headaches, according to the Georgia Southern University conference record. People can rate air as broadly acceptable and still report symptoms worth investigating.
Perception also depends on layout. A 2025 systematic review found that enclosed private offices increased perceived-air-quality satisfaction by 88% compared with open spaces without partitions, while increasing ventilation from 3 to 20 L/s per person increased satisfaction by 63% under the studied conditions, as reported in the INRS documentary portal record. Density, odours from neighbours, and uneven airflow can drive complaints even when a hallway sensor looks calm.
The performance link is measurable too. The 2021 Global CogFx study from Harvard's Healthy Buildings program followed 302 office workers in six countries and found that for every 10 micrograms per cubic meter increase in PM2.5, response times became approximately 0.8% to 0.9% slower, while correct responses per minute declined by about 0.8% to 1.7%. Each 500-parts-per-million increase in CO2 was associated with response times slowing by 1.4% to 1.8% and test throughput falling by 2.1% to 2.4%. Those effects appeared at conditions commonly found indoors, not only during extreme events.
Ask three questions in any office. What's measured, what air is delivered, and how do people feel in the space? If you can only answer one, you don't have the full picture yet.
Each effect is small for one person in one hour. Across a full workforce and a full working day, small losses in speed and accuracy stop being small.
Office Air Quality Limits and Reference Values
Start with the table, then read the warnings underneath it. These are reference values for interpreting your own readings, drawn from ASHRAE's position document on indoor carbon dioxide, which states that CO2 is not a complete measure of indoor air quality and that commonly used CO2 values shouldn't be treated as health based limits.
Indicator | Reference value | What it tells you |
|---|---|---|
CO2 in offices and classrooms with younger students | about 1,000 ppm | Outdoor-air ventilation per person, not a health limit |
CO2 in restaurants, lecture classrooms and retail | 1,500 to 2,000 ppm | Expected steady-state range under Standard 62.1 |
CO2 in conference rooms and auditoriums | above 2,500 ppm | Expected steady-state range for high-occupancy rooms |
Indoor PM2.5 | Compare indoor with outdoor at the same time | Compare with outdoor levels and track the trend; no single limit in this research |
How To Read A CO2 Number
ASHRAE describes a concentration below 1,000 ppm as, at best, an indicator of outdoor air ventilation per person. It isn't a cleanliness threshold, and it doesn't clear a room of other pollutants. What matters is the expected range for that type of space under Standard 62.1, and how your reading compares with it over time.
Here's the worked example that trips people up. A conference room reading 1,800 ppm sits below the expected steady state range of above 2,500 ppm for conference rooms and auditoriums, so on its own it doesn't prove under ventilation for that room type. The same 1,800 ppm in a private office is well above the about 1,000 ppm benchmark for offices, and that calls for a ventilation check. Same number, different verdict, because occupancy density differs.
For context on how these values sit within wider guidance, see this overview of indoor air quality standards. The practical rule is to compare like with like. Judge a meeting room against meeting rooms, not against a single person office.
Where Normal Office Values Come From
For a U.S. reference point on typical buildings, the EPA Building Assessment Survey and Evaluation study overview describes a five year effort from 1994 to 1998 covering 100 randomly selected public and commercial office buildings in 37 cities across 25 states. Because the sample was random, it produced normative values for typical offices rather than a portrait of unusually polluted ones. That's the right kind of baseline for asking whether your building is unusual.
For PM2.5, don't hunt for a single pass or fail line in this material. Compare indoor readings with outdoor levels at the same time and track the trend across weeks. An indoor level that tracks outdoor spikes closely points to infiltration or weak filtration. One that rises when the break room is busy points indoors.
Practical rule: A CO2 value that stays well above the expected range for its space type points to ventilation delivery. Investigate airflow, dampers, and occupancy assumptions before you buy equipment.
Key Pollutants and Where They Come From
The table below maps what's likely in your air to where it usually enters an office day. Keep it beside any complaint log, because the source usually tells you the fix.
Pollutant | Common office source | Typical effect |
|---|---|---|
Environmental tobacco smoke | Smoking near entrances, drawn in through air intakes | Eye, nose and throat irritation, headaches |
Formaldehyde and volatile organic compounds | Building materials, paints, adhesives, cleaning products | Headaches, dizziness, fatigue |
Asbestos | Older building materials disturbed during renovation | Serious lung disease after long exposure |
Biological contaminants and mold | Dirty ventilation systems, water-damaged walls, ceilings and carpets | Irritation and allergic reactions |
Radon | Soil gas entering lower floors | Increased lung cancer risk with prolonged high exposure |
Particulate matter (PM2.5) | Outdoor traffic, wildfire smoke, break-room cooking | Slower response times and respiratory symptoms |
Copying machines | Emissions during printing and copying | Irritation of eyes and airways |
Carbon monoxide | Combustion sources and nearby parking areas | Headaches, dizziness, fatigue |
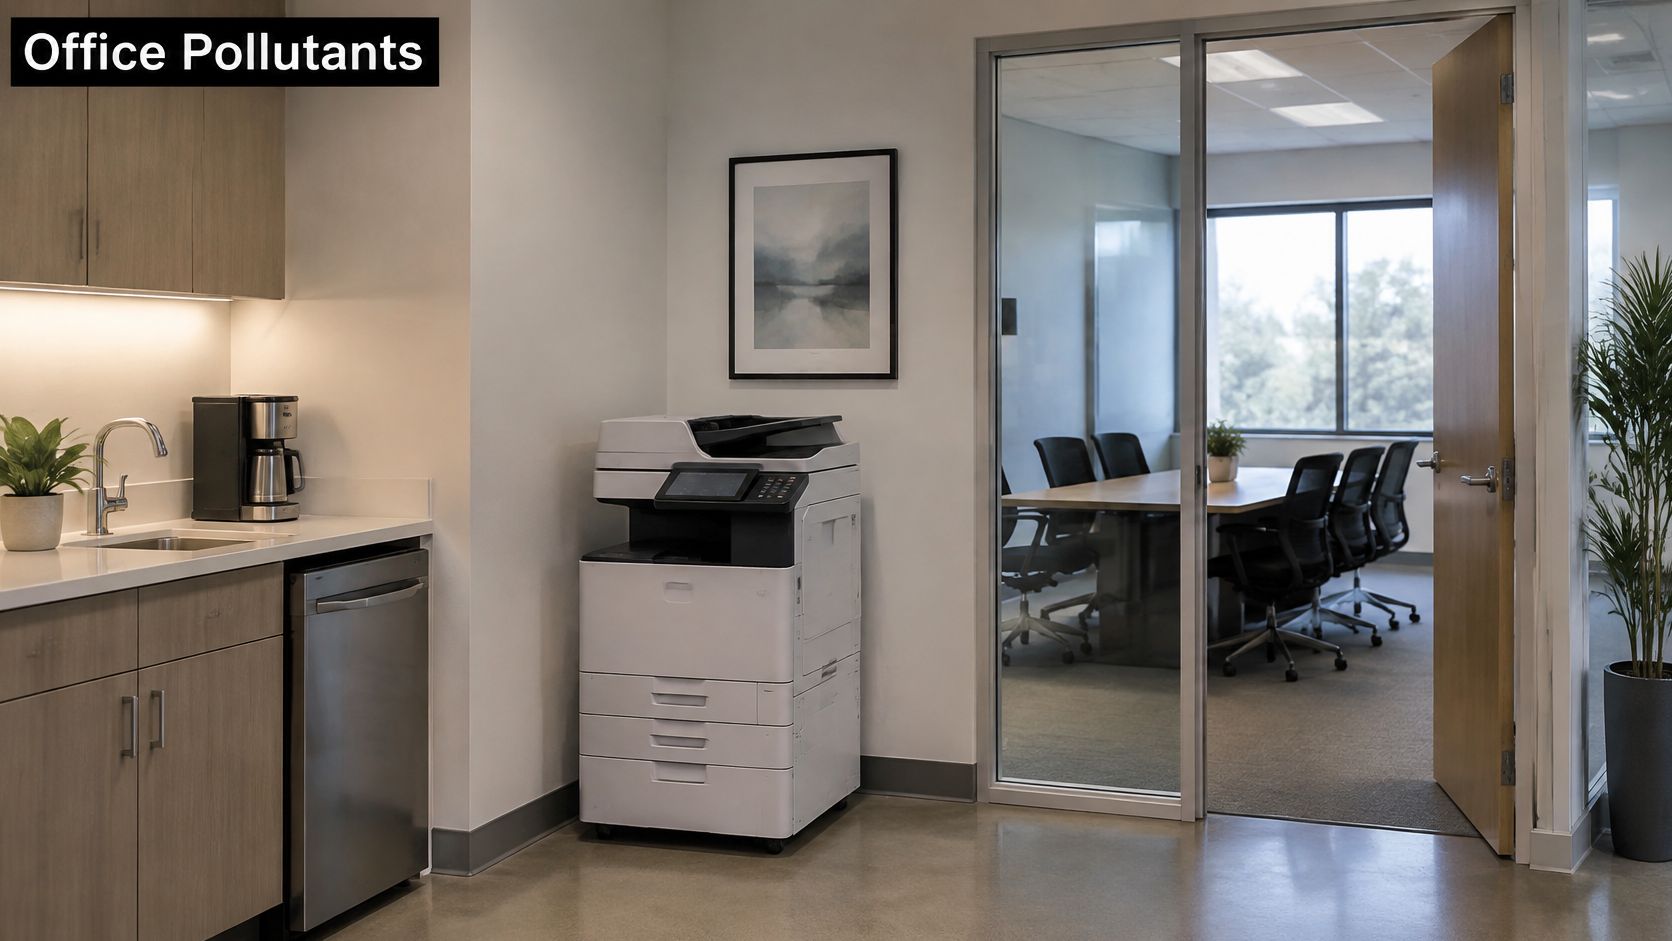
The sources in that table cluster around everyday office features, from entrances and printers to renovated meeting rooms.
Three Causes Behind Most Problems
The U.S. Environmental Protection Agency office air problem guide identifies three major causes of poor indoor air quality in office buildings: indoor pollution sources, ventilation systems that are poorly designed, maintained, or operated, and building uses that were not anticipated during design or renovation. That third cause is easy to miss. A storage room converted to a six person office inherits ventilation sized for boxes, not people.
The EPA list of office sources includes environmental tobacco smoke, asbestos, formaldehyde and other compounds from building materials, cleaning products, paints, adhesives, copying machines, pesticides, and biological contaminants tied to dirty ventilation systems or water damaged walls, ceilings, and carpets. Renovation deserves special care, since disturbing older materials and introducing new finishes can happen in the same week. If fresh paint is part of the job, plan the ventilation and curing time described in this guide to paint fume removal before staff move back in.
Delivery fails as well. Blocked or poorly positioned supply and return vents can prevent outdoor air from reaching occupants' breathing zones even while the system runs and energy bills look normal. A bookcase against a return grille is a ventilation problem disguised as furniture.
The control logic follows from the causes. The EPA office building occupants guide to indoor air quality describes a three part strategy: manage or remove pollution sources, dilute and remove pollutants through ventilation, and use filtration to clean contaminants from the air. Map each pollutant in the table to one of those three levers and you've got the outline of a plan, instead of a shopping list.
How to Measure Office Air Quality Step by Step
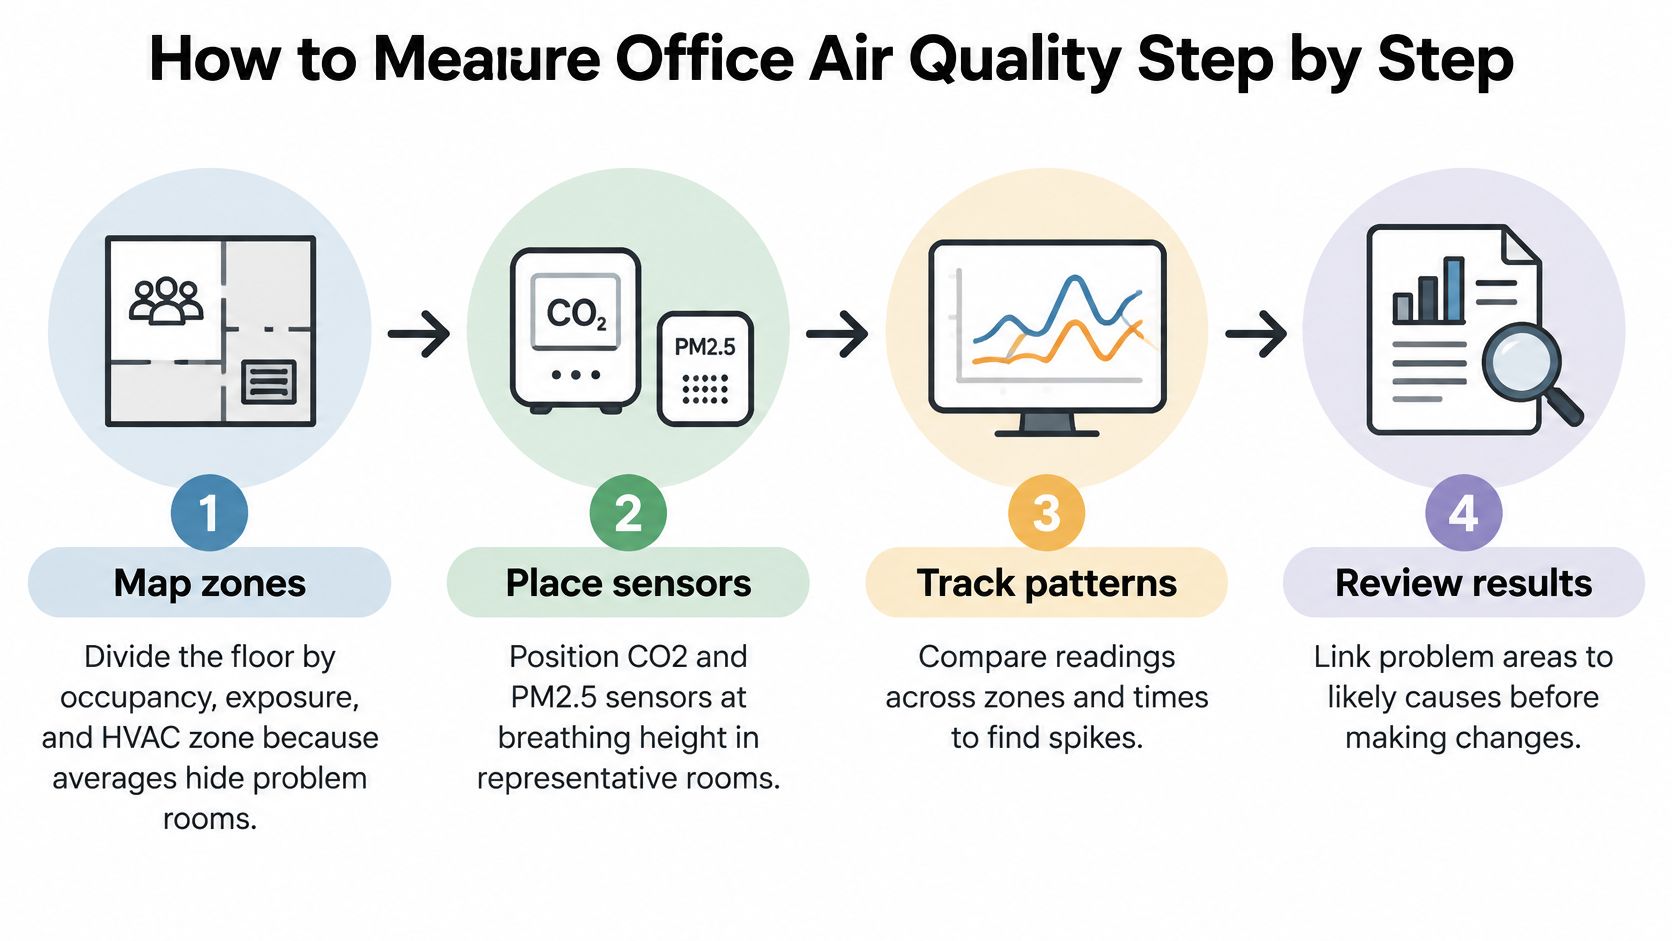
Don't start by buying sensors for the whole floor. Start by deciding what question each sensor has to answer, zone by zone. Building averages hide problem rooms, and problem rooms are where complaints come from.
Seven Steps From Map To Diagnosis
Map zones first: Divide the floor by occupancy, exposure such as entrances and kitchens, facade orientation, and HVAC zone. You're looking for contrasts, not coverage.
Place sensors at breathing height: Put CO2 and PM2.5 sensors where people sit, away from supply diffusers and windows. A sensor beside a vent underreports the room because it samples fresh supply air.
Log for two weeks: Record CO2, PM2.5, temperature, and relative humidity through a normal week and a busy one. Peak days expose weaknesses that quiet days hide. A decent starting instrument is an indoor air quality meter that logs data rather than showing a single snapshot.
Survey occupants anonymously: Ask about stuffiness, odour, noise, temperature, and control over their space, and tie every response to a zone. Complaints clustered in one zone with normal readings point to distribution or design, not a building wide pollutant.
Inspect the air path: Check supply and return vents for blockage by furniture, boxes, or paper. Confirm outdoor air dampers open as designed, on site, not just on the control screen.
Compare zones against reference values: Match each room to the expected range for its type and trend the data across days. Judge patterns, not single readings taken during one crowded meeting.
Chase persistent elevation mechanically: If CO2 stays high in a zone, work through dampers, airflow rates, design occupancy assumptions, and air distribution in that order.
The Interpretation Rule That Governs Every Step
Treat CO2 as a ventilation diagnostic, not a complete air quality measurement. The ASHRAE guidance hosted by NIST states that indoor CO2 doesn't indicate pollutants whose emissions are unrelated to occupancy, including outdoor PM2.5, nitrogen dioxide, ozone-driven reaction products, and many volatile organic compounds. A concentration below 1,000 ppm can serve as a rough indicator of outdoor air ventilation per person, but it isn't a health based cleanliness threshold.
That means a normal CO2 reading doesn't prove formaldehyde, volatile organic compounds, or mold are absent. If symptoms persist in a zone with reassuring CO2, you need targeted testing for the suspected source, plus a moisture inspection. Trend CO2 alongside PM2.5, temperature, relative humidity, and known pollutant sources so one blind spot doesn't become your conclusion.
Keep a one page zone log with four columns: room, reading pattern, complaint, and next check. If a row has a complaint but no next check, the log isn't doing its job.
Finish by ranking zones, not readings. A room that's high on CO2, high on complaints, and visibly blocked at the return vent outranks a room with one odd spike and no symptoms.
Common Causes of Poor Air and How to Fix Them
The most common cause isn't exotic. It's poor delivery of outdoor air through blocked or unbalanced vents, showing up as stale air and high CO2 in the afternoon. The fix starts with clearing supply and return vents of furniture and paper, then verifying damper settings and measuring airflow in the affected zone. That's a one day job, and it should happen before any purchase order.
Symptom | Likely cause | Fix |
|---|---|---|
Stale air, afternoon drowsiness, high CO2 | Insufficient outdoor air or blocked vents | Clear vents, verify damper settings, check airflow |
Dust on vents and surfaces, rising complaints | Dirty supply ducts and grilles | Duct and vent cleaning with HEPA-filtered equipment |
Weak airflow, uneven temperatures, musty smell | Dirty HVAC coils or clogged filters | Coil cleaning and filter change on a set schedule |
Musty smell or visible growth near vents | Mold from moisture or water damage | Fix the moisture source, then clean affected ductwork |
Irritation in one zone only | Poor air distribution or a nearby source | Rebalance airflow and move the source away from occupants |
Odour after renovation or new furniture | Off-gassing from new materials | Increase fresh outdoor air during and after the work |
What You Can Fix Today Versus What Needs A Visit
Clearing vents, checking dampers, moving a printer away from desks, and relocating cleaning chemical storage away from air intakes are same day fixes. So is confirming that exhaust vents in break rooms and washrooms draw air, since those rooms generate odours and moisture that migrate. Check exhaust alongside supply, not as an afterthought.
Dust building up on vents and surfaces tells a different story. Air duct cleaning removes dust, allergens and contaminants from the air duct system, and it's a service visit, not a janitorial task. Ducts are generally recommended to be cleaned every 3 to 5 years, depending on ductwork age and condition, the type of heating and cooling system, and any allergies or respiratory problems among occupants.
Be candid about the risks of doing that work badly. The risks of air duct cleaning include dust and debris released into the air, allergic reactions, and mold growth, and these risks are rare when the work is done properly by a qualified company. Ask how debris will be contained before anyone opens a duct.
Weak airflow with uneven temperatures and a musty edge usually points at dirty HVAC coils or clogged filters. Coil cleaning needs specialized equipment, and filters need changes on a set schedule rather than when someone remembers. Log the date, the filter rating installed, and the pressure condition you found.
Mold or water damage near vents breaks the usual order. Fix the moisture source first, then clean affected ductwork, or the growth returns to a clean duct. Irritation confined to one zone is different again. Rebalance airflow there and move the nearby source before you assume the whole building shares the problem.
Choosing Between Filtration, Ventilation and Purification
Match the control to the situation in front of you, not to the equipment catalogue. This table puts the primary move first for each common scenario.
Situation | Primary control | Watch for |
|---|---|---|
Normal season, steady occupancy | Required outdoor air plus the highest filter efficiency the unit can handle | Pressure drop and delivered airflow |
Wildfire smoke days | Temporarily reduce outdoor-air intake and filter recirculated air | Outdoor AQI and indoor PM2.5 trend |
Dusty or traffic-exposed site | Filter upgrade confirmed against fan capacity | Filter loading and replacement frequency |
Persistent complaints in one zone | Check air distribution and zoning before adding equipment | Airflow per zone and occupant survey results |
Allergen or pathogen concern in ducts | In-duct or portable purification as a supplement | Ventilation kept in place and maintenance schedule followed |
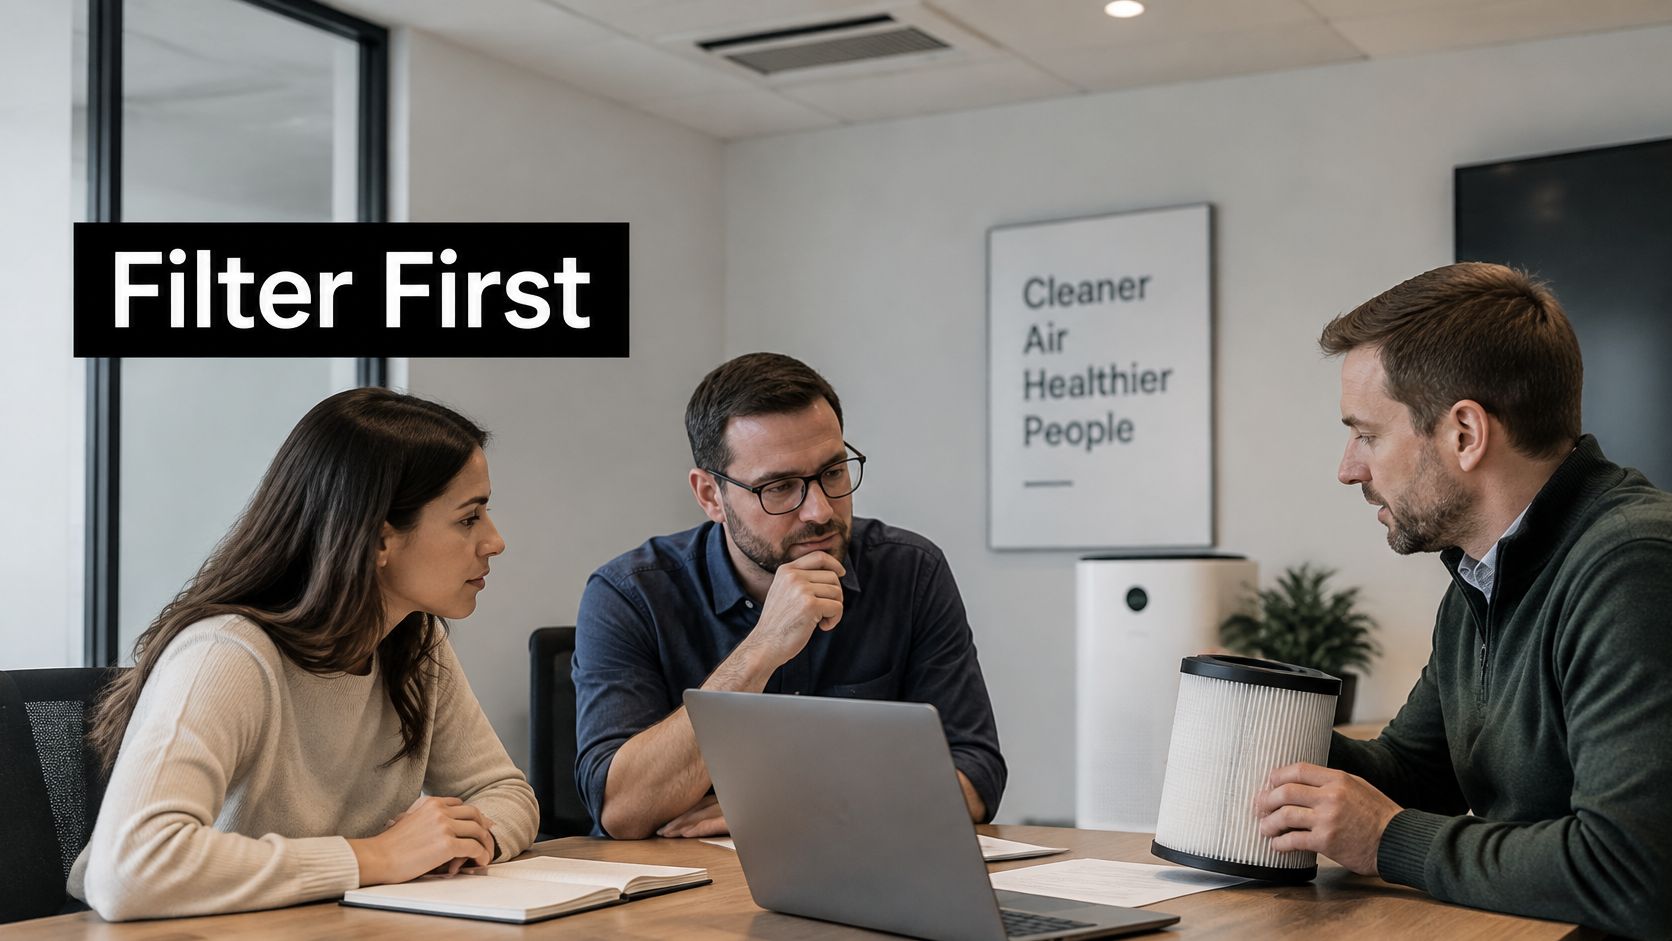
The reasoning starts with filters. An EPA-indexed office-building filtration study compared MERV 8 filters with MERV 14/15 filters across ventilation rates of 1.0, 2.4, and 5.4 air changes per hour and found that higher efficiency filtration generally produced lower indoor-to-outdoor PM2.5 ratios, even when ventilation was lower. Particle filtration can therefore affect office PM2.5 more than raising the air exchange rate. Provide the required outdoor air, then fit the highest efficiency your air handling unit can handle without excessive pressure drop, reduced airflow, or fan overload.
A filter upgrade without verification can backfire. Pair it with pressure drop measurements, filter change monitoring, and delivered airflow checks. Otherwise, a nominally better filter starves the zones it was meant to help.
The filter options and their trade offs get easier to judge when you see what you're handling and how loading changes performance over time.
The Smoke Day Exception
Wildfire smoke reverses the usual advice, because outdoor air can be dirtier than recirculated indoor air. Health Canada's 2025 office building guidance recommends temporarily reducing outdoor-air intake during smoke events, upgrading recirculation filters to MERV 13 only after confirming that HVAC equipment can handle the added pressure drop, monitoring filter loading, and measuring indoor PM2.5. It also cautions that higher efficiency filters may need more frequent replacement. Build that decision before smoke season, linking outdoor AQI, indoor PM2.5, and filter condition, rather than improvising under a hazy sky.
For the ventilation side of that balance in larger buildings, this overview of commercial building ventilation covers how outdoor air delivery is normally sized and controlled. Bring in an HVAC engineer when you're unsure about fan capacity, building pressure, or whether a filter change will cut delivered airflow. That consult costs less than equipment that underperforms.
Purification sits on top of those basics, not in place of them. ActivePure Technology is available as a unit installed in a residential or commercial air duct, or as a plug-and-play unit placed anywhere in a home or office. It's scientifically proven to decontaminate 99.98% of pathogens and contaminants in the air and on exposed surfaces without releasing any harmful byproducts. Like any system, it needs upkeep, and we provide regular maintenance for the air purification systems we install.
This short video shows how purification fits alongside ventilation and filtration in practice, rather than replacing either one.
Prioritize Your Office Air Quality Actions
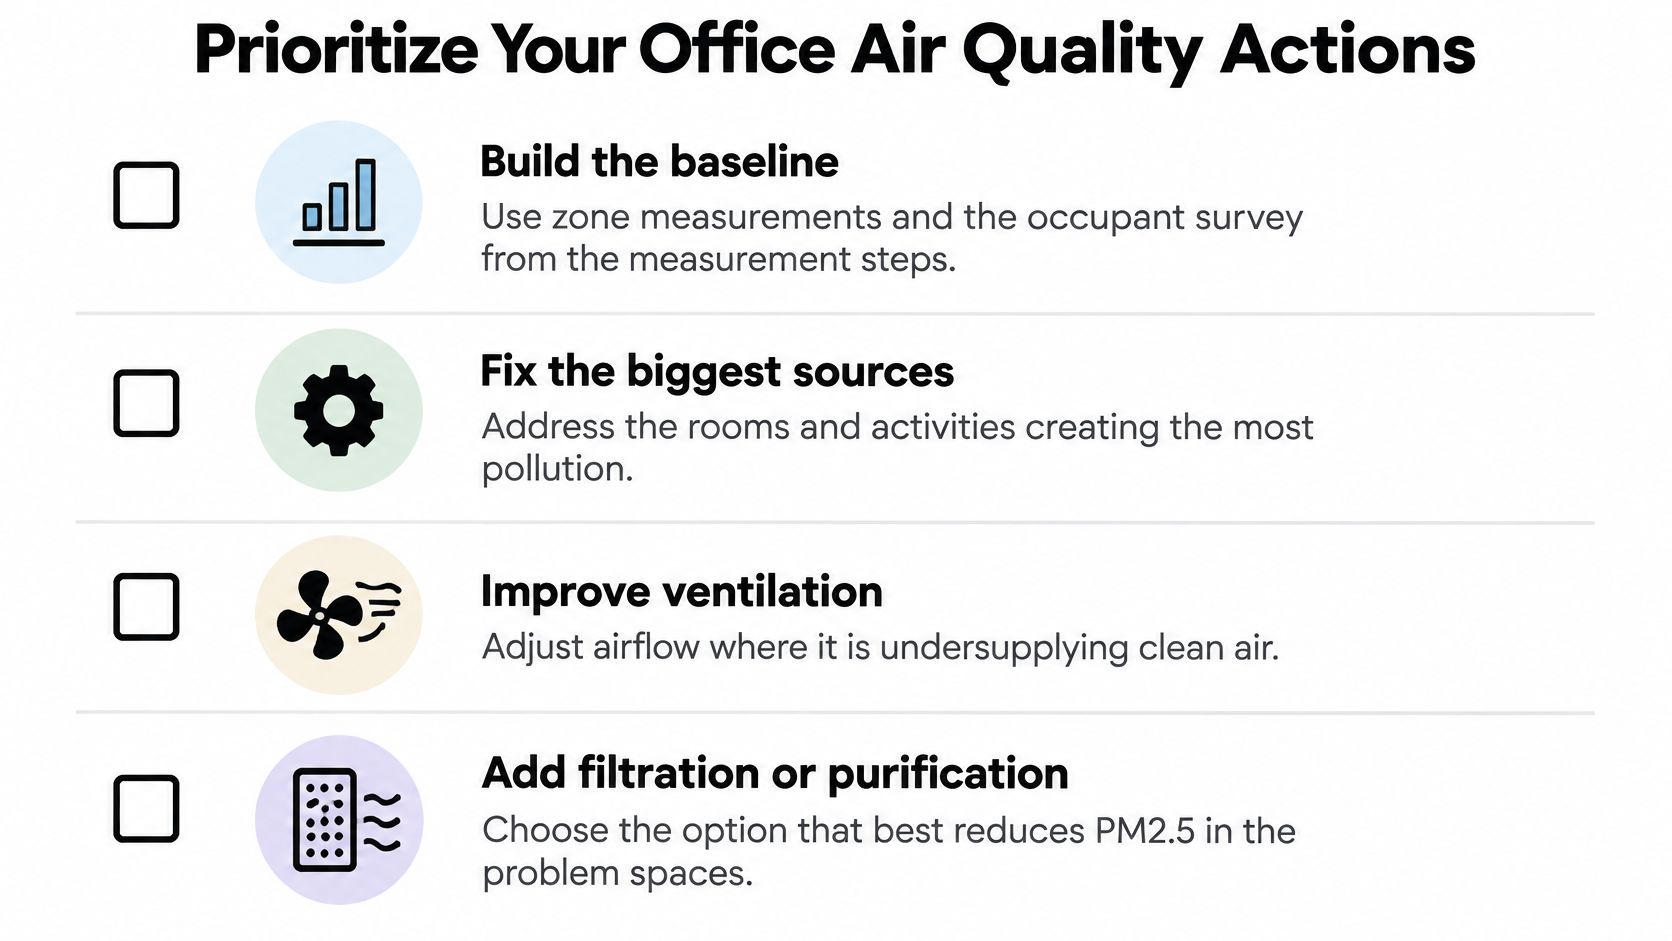
Order matters because each step tells you whether the next one is needed. Work down this list and stop expanding the project when the evidence stops justifying it.
Build the baseline: Zone measurements plus the occupant survey, so instrument data and lived experience land on the same page.
Restore outdoor air delivery: Clear vents and confirm damper settings in the worst zones first.
Clean where evidence concentrates: Ducts and vents in zones with visible dust or clustered complaints, not automatically everywhere.
Put coils and filters on schedule: Coil cleaning and filter changes with dates logged, not remembered.
Upgrade filtration carefully: Confirm fan capacity and pressure drop first, and follow the reduced outdoor air rule on smoke days.
Remove or move sources: Smoking areas away from intakes, printers away from desks, cleaning storage away from supply air.
Add purification last: In-duct or portable units for persistent allergen or pathogen concerns, with ventilation kept running.
That last step deserves a proper assessment rather than a guess. Our air purification systems are NASA Certified, and we provide air duct and HVAC cleaning for both residential and commercial customers. For purification specifically, we assess each customer's specific needs and recommend the most suitable system, so the unit matches the space instead of the brochure.
Do one thing this week. Complete the zone baseline and the occupant survey, then request a needs assessment from a qualified provider of commercial air duct services with that log in hand. You'll get a sharper recommendation, and you'll be able to tell whether it worked.
If your zone log is pointing at dirty ductwork, tired coils, or a purification gap, Purified Air Duct Cleaning offers commercial air duct cleaning, HVAC coil cleaning, and NASA Certified ActivePure purification systems, in-duct or portable, selected after assessing your site's specific needs. We'll walk through your readings and occupant feedback with you and recommend fixes in the order that improves office air quality, so visit Purified Air Duct Cleaning to request your assessment.