

How to Measure Indoor Air Quality at Home
You notice the air before you measure it. Maybe the living room feels stale in the evening, someone starts sneezing after the heat comes on, or a musty odor returns even after cleaning. A plug-in monitor then displays a worrying number, but it doesn't tell you whether the reading reflects the whole room, a nearby source, or a sensor error.
Learning how to measure indoor air quality means treating the home like a changing system, not a single number on a screen. Occupancy, cooking, cleaning, outdoor pollution, humidity, filtration, and HVAC operation all alter what you breathe. A useful test connects pollutant readings with time, location, building conditions, and occupant activity, so you can decide whether the right response is better ventilation, filtration, moisture control, source removal, or professional investigation.
Why Guessing About Your Air Quality Fails
A homeowner may see dust floating through a shaft of afternoon sunlight and assume the HVAC system is failing. Another may wake with a stuffy nose, buy a purifier, and expect the symptoms to disappear. A third may smell something musty in the basement and order duct cleaning without checking for moisture. These observations matter, but none identifies the pollutant or its source by itself.
A cheap sensor can create the same problem in reverse. It might show a sudden particulate spike while someone cooks, then return to a low reading after the pan is removed. That pattern could indicate a short-lived source, but it doesn't prove that the rest of the house has a persistent particle problem. A sensor placed beside a return grille, open window, or dusty appliance may report local conditions rather than the air in the breathing zone.

Start with a decision
The first question isn't “Which monitor should I buy?” It's “What decision must the measurement support?” You may be trying to determine whether:
Ventilation is adequate: Occupancy and HVAC operation may leave a bedroom, office, or classroom under-ventilated.
Particles enter during outdoor events: Smoke, dust, or traffic pollution may be infiltrating through outdoor-air pathways.
A source is episodic: Cooking, cleaning, candles, renovations, or combustion equipment may cause short peaks.
Moisture creates a building problem: High humidity, condensation, or a musty odor may justify targeted moisture and biological investigation.
A safety hazard exists: Carbon monoxide and radon require dedicated testing rather than a general air-quality display.
A defensible baseline starts by defining the pollutants, rooms, operating conditions, measurement period, and action thresholds before equipment is deployed. The overview of indoor air quality fundamentals is useful background, but practical testing still requires a written plan.
Practical rule: A single reading can start an investigation. It shouldn't end one.
Symptoms are clues, not diagnoses
Sneezing, irritation, fatigue, odors, and visible dust can help identify when to measure, but they don't reveal whether particles, VOCs, humidity, poor ventilation, or an unrelated issue is responsible. Treat them as time-stamped observations. Record where people were, what the HVAC system was doing, and whether cooking, cleaning, or outdoor pollution occurred.
The goal isn't to collect the most impressive number. It's to produce repeatable evidence that answers a building question. That means comparing occupied and unoccupied periods, looking for source-linked patterns, and keeping raw readings alongside notes about what happened in the space.
Identifying the Right Pollutants to Test
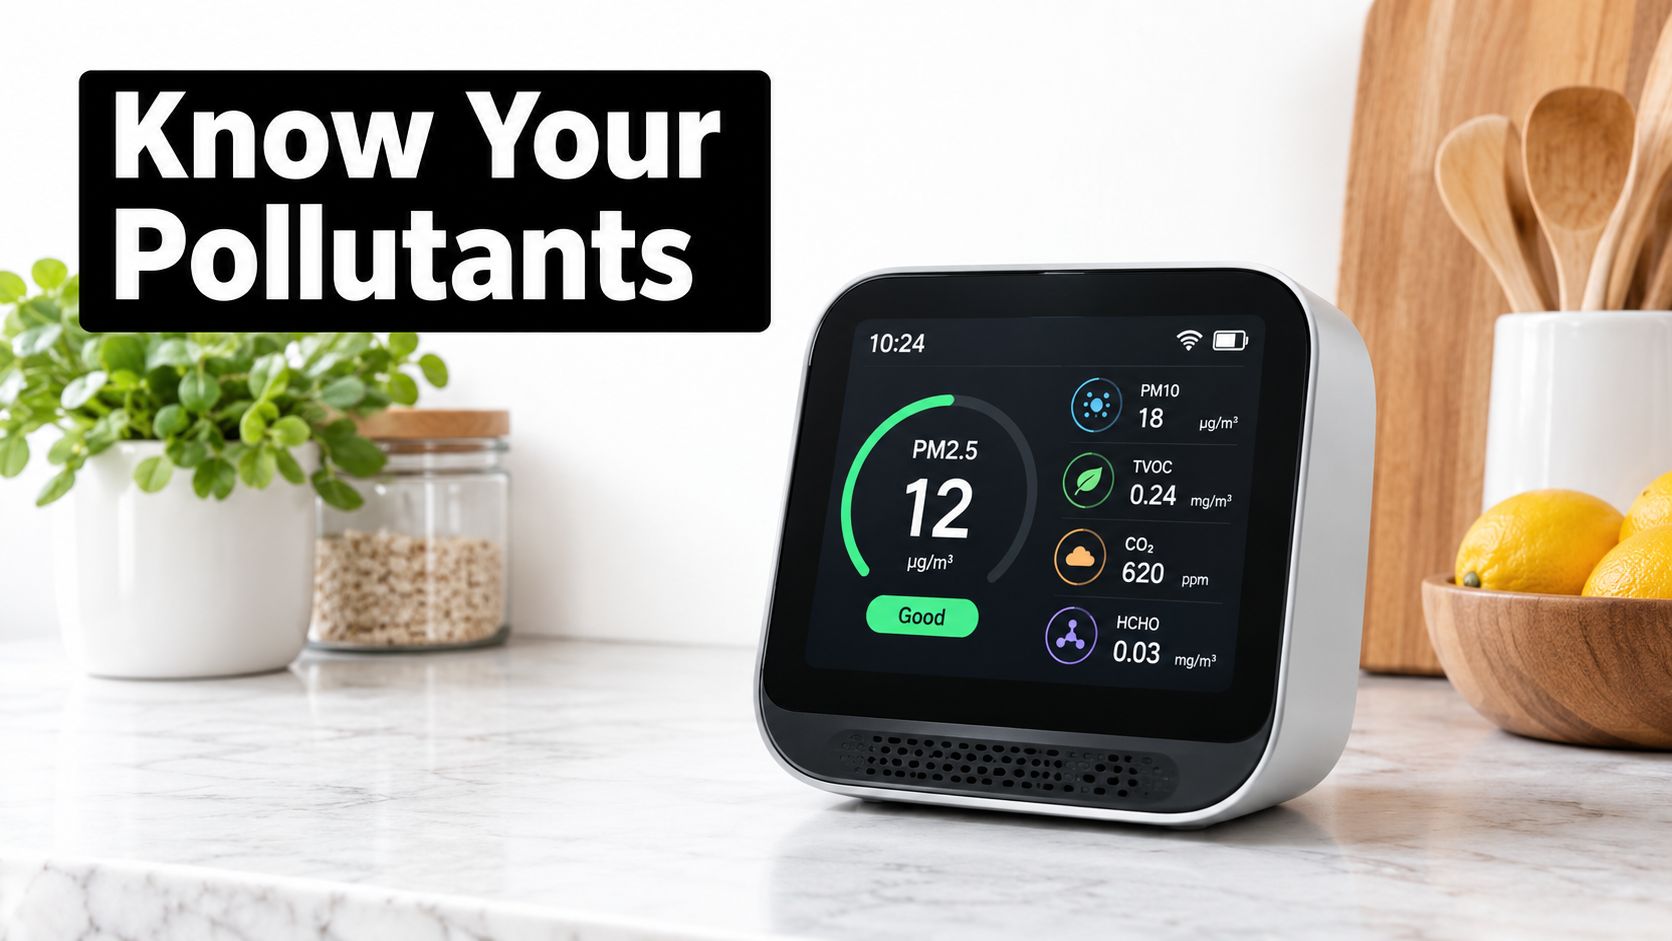
Before purchasing equipment, define the objective and select pollutants that can answer it. A basic home assessment commonly considers PM2.5 and PM10, carbon dioxide, carbon monoxide, temperature, and relative humidity. Add targeted testing for VOCs, formaldehyde, radon, or biological aerosols when the building's history, odors, renovations, fuel-burning equipment, or occupant symptoms justify it.
Match the pollutant to the question
PM2.5 and PM10 help investigate particles from combustion, outdoor smoke, cooking, dust, and resuspended debris. PM2.5 is especially useful when wildfire smoke or combustion is a concern, while PM10 can help reveal larger dust sources. An optical particle sensor can show trends, but humidity and particle composition can affect its response, so a spike should lead to source investigation rather than an automatic conclusion.
Carbon dioxide is best treated as a ventilation-use indicator. People exhale it, so rising readings during occupancy can show that outdoor-air delivery isn't keeping pace with the room's use. CO2 doesn't measure particles, VOCs, pathogens, or overall air quality. It answers one narrower question: how does ventilation respond to occupancy?
Temperature and relative humidity provide context for comfort, condensation, and moisture risk. A particle reading without humidity data is harder to interpret, particularly when an optical sensor may respond differently under changing moisture conditions.
VOCs and formaldehyde need more care than a consumer “TVOC” display suggests. A general monitor may show a broad response from several gases, but it usually can't identify which compound is present or establish a defensible concentration. Recent flooring, paint, adhesives, cabinets, furniture, or cleaning products can justify passive or integrated laboratory sampling.
For renovation projects, material selection is part of source control. Someone researching a safe floor finish for Parker homes may be reducing the likelihood of introducing avoidable emissions, but material choices don't replace measurement when occupants report symptoms or odors.
Keep life-safety testing separate
Carbon monoxide must be measured with a dedicated CO alarm, not inferred from a general-purpose indoor air monitor. The EPA reports that average CO concentrations in homes without gas stoves commonly range from 0.5 to 5 parts per million, while areas near properly adjusted gas stoves often measure 5 to 15 ppm. Poorly adjusted stoves may reach 30 ppm or higher, as described in the EPA guidance on carbon monoxide and indoor air quality.
Install CO alarms on every level of a home and outside each sleeping area, following the Consumer Product Safety Commission's guidance. If an alarm sounds, leave the building and contact emergency services or the appropriate fuel and HVAC professionals. Don't wait for a multi-pollutant monitor to confirm a safety event.
Radon requires a separate test because ordinary particle, humidity, and CO2 sensors don't detect this radioactive gas. The EPA expresses radon in picocuries per liter, or pCi/L, and recommends fixing a home at 4 pCi/L or higher, equivalent to 150 Bq/m³. The agency recommends considering mitigation between 2 and 4 pCi/L, equivalent to 75 to 150 Bq/m³, because no risk-free exposure level is known. Follow-up testing is recommended when a short-term test reaches or exceeds 4 pCi/L, as explained in EPA's radon action-level guidance.
For a practical overview of monitor functions and limitations, use this guide to air-quality sensors as a starting point, then select equipment based on the decision you need to make.
Choosing Between Consumer Monitors and Professional Tools
A consumer monitor can be valuable when you use it as a trend recorder. It may show that PM2.5 rises during cooking, that CO2 increases when a bedroom door is closed, or that humidity changes after the HVAC system cycles. Those patterns help you decide what to investigate.
The same device becomes unreliable when you treat its display as a compliance result or a laboratory measurement. The EPA states that low-cost monitors are generally intended for supplemental, non-regulatory monitoring, not compliance determinations. It also notes that indoor reference methods and widely accepted performance criteria aren't equivalent to those available for many outdoor measurements, as described in its guidance on low-cost air pollution monitors and indoor air quality.
Know what the instrument can actually tell you
Low-cost optical particle counters estimate particle levels by measuring how particles scatter light. Humidity, particle size, particle shape, and composition can influence the result. A sensor may be excellent for identifying a repeated pattern in one home, yet disagree with another instrument in a way that makes the absolute value unsuitable for a major remediation decision.
A CO2 monitor can be useful for ventilation diagnostics, but it doesn't establish that air is free from particles or chemicals. A TVOC display may respond to a mixture without identifying individual compounds. A temperature and humidity reading can reveal conditions favorable to condensation, but it doesn't prove that mold is present.
Testing Method | Best For | Key Limitations |
|---|---|---|
DIY PM, CO2, temperature, and humidity monitor | Tracking trends, occupancy effects, HVAC cycles, and source-linked events | Sensor bias, humidity effects, limited pollutant specificity, and weak suitability for compliance decisions |
Collocated calibrated instrument | Comparing a low-cost sensor with a reference or professionally calibrated device | Requires careful setup, documented comparison, and validated correction |
Passive or integrated laboratory sampling | Formaldehyde, VOCs, radon, and other pollutants a consumer monitor can't reliably identify | Requires correct siting, laboratory analysis, and chain-of-custody documentation |
Professional diagnostic survey | Connecting readings with HVAC operation, building history, moisture, and corrective decisions | Costs more and depends on the technician's method, equipment, and reporting quality |
Use professional testing for consequential decisions
For higher-confidence results, place the consumer sensor beside a reference or professionally calibrated instrument. Quantify the difference, apply a correction only when it has been validated and documented, and preserve both raw and corrected data. Without that record, changing the displayed value can create false precision.
Passive sampling is particularly practical for some chemical investigations because it requires no pump or power and allows simultaneous deployment. A laboratory method and documented chain of custody matter more than a colorful dashboard when the result may influence remediation, a property transaction, or a ventilation upgrade.
Readers comparing equipment and measurement approaches can also review these indoor air insights from WipesBlog.com. For household trend tracking, a guide to the best air-quality monitors for home use can help narrow the options, but the purchase should follow the testing objective, not replace it.
Executing a Proper Sensor Placement Strategy
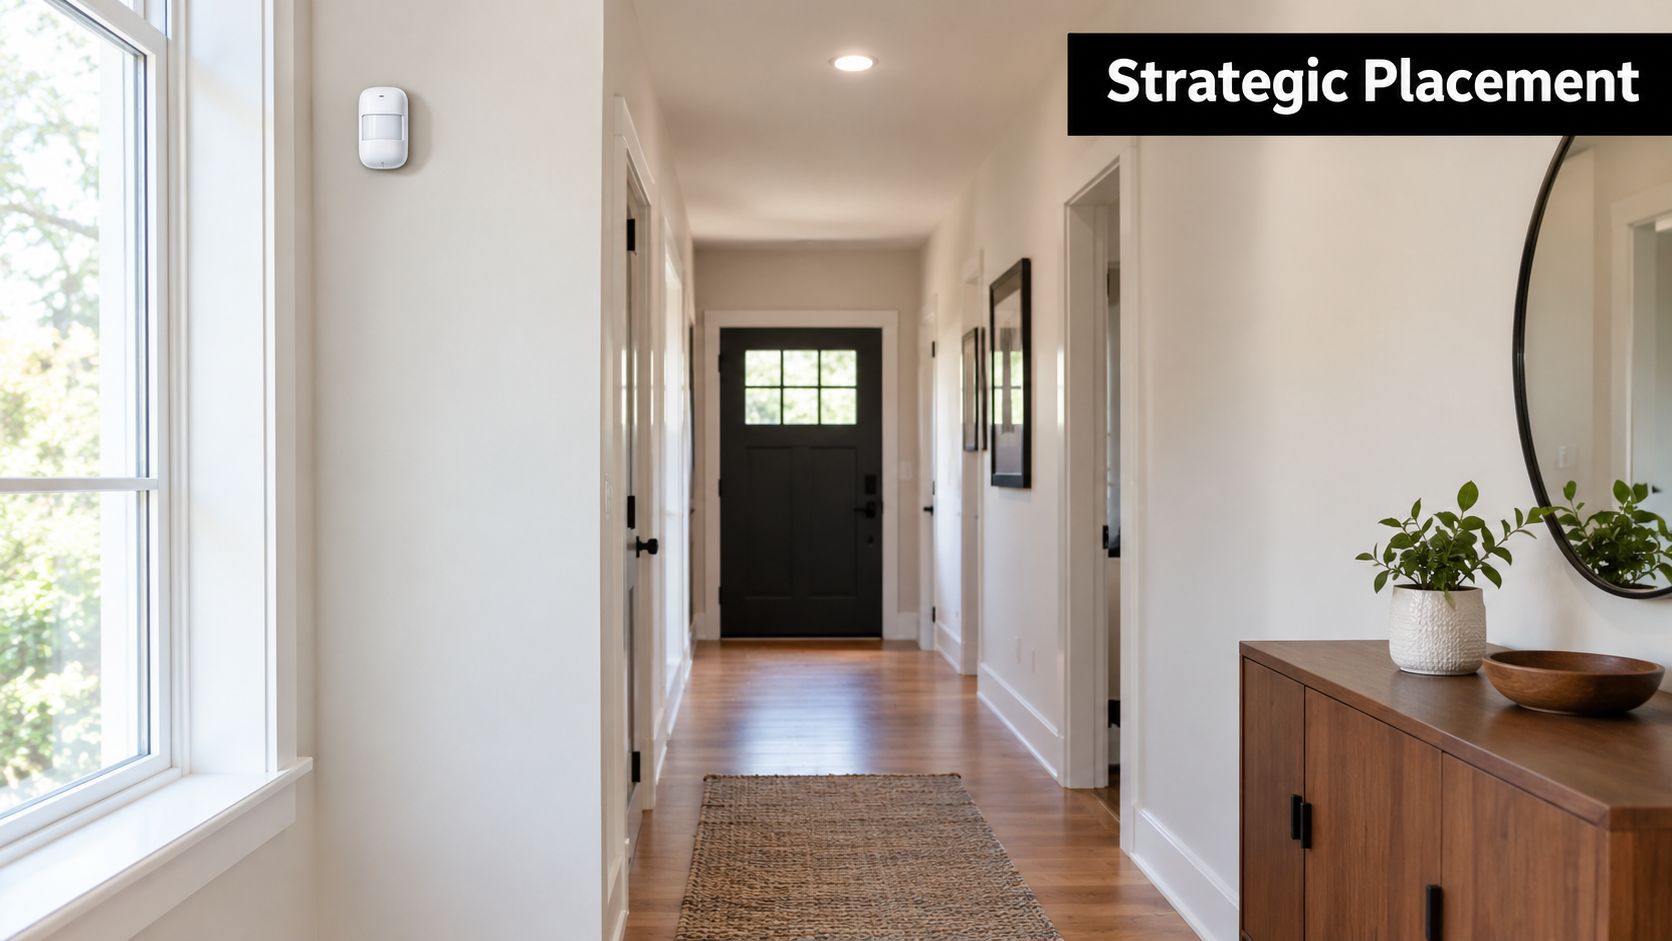
Placement determines whether your monitor measures representative room air or a small local plume. A sensor beside an open window may measure outdoor air. One under a desk may sit in a stagnant pocket. Another mounted directly above a supply diffuser may report freshly conditioned air before it mixes with the room.
Build the deployment before turning on the monitor
Choose representative rooms. Start with the spaces where people spend time, where complaints occur, and where sources are likely. A bedroom, living area, home office, basement, or classroom may each have a different pattern. Don't place every sensor in the easiest location.
Set the breathing-zone height. Position monitors roughly 1.0 to 1.5 meters above the floor, near the height of a seated or standing occupant's breathing zone. WHO and ISO guidance commonly recommends the room center or approximately 1.0 to 2.0 meters from walls.
Create separation from local disturbances. Keep the instrument away from walls, windows, supply diffusers, cooking appliances, direct sunlight, drafts, fans, and humidifiers. Don't hide it behind furniture or place it directly beside a return grille.
Define the operating period. Log at least one representative occupied cycle. The useful period depends on the building question, but it should include ordinary occupancy and normal HVAC operation rather than a carefully staged “clean” day.
Record the context. Note occupancy, ventilation status, fan operation, filtration, cooking, cleaning, open windows, outdoor conditions, and unusual events. These notes turn a graph into a diagnostic record.
Keep the settings consistent. Use a logging interval that captures changes rather than reducing the entire day to a few spot readings. Confirm the clock, battery, data storage, and calibration checks before deployment.
A written sampling plan and SOP should name the rooms, operating conditions, duration, logging interval, calibration checks, and action thresholds. If you can't explain where a monitor was placed and what the building was doing at the time, you won't be able to defend the conclusion later.
Wildfire and dust conditions make timing especially important. A 2025 University of Utah study used approximately $450 wireless sensors across 17 indoor and two outdoor locations and found that wildfire smoke produced four to five times more indoor PM2.5 infiltration than pollution from inversions and dust events. The study also found exceedances of international health guidelines were rare and occurred mainly in buildings using air-side economizers, according to the trade coverage of the University of Utah findings.
Compare indoor and outdoor conditions
The outdoor reference doesn't need to be in the same room, but it should have a known location and consistent timestamps. Compare indoor PM2.5 with outdoor conditions, then annotate HVAC fan status, filtration, economizer operation, cooking, cleaning, and wildfire conditions. This can reveal whether a spike came from indoor activity or infiltration.
Use the following video as a visual reminder that sensor deployment is a building investigation, not just a device installation:
Don't assume that bringing in more outdoor air always improves conditions. During a smoke event, an outdoor-air damper or economizer can introduce pollution, while return-air pathways and filtration may determine how much enters the occupied space. Affordable networked sensors can expose these building-specific patterns, but they should support source investigation and HVAC decisions rather than replace calibrated testing.
Interpreting Your Data and Spotting Real Problems
A graph full of readings still requires judgment. Start with the median, daily peaks, and 95th-percentile values, then compare them with occupancy and event notes. The median describes the usual condition, the peaks reveal source events, and the 95th percentile shows whether high readings are occasional or occupy a meaningful part of the measurement period.
A cooking spike that begins when a burner is used and falls after ventilation starts has a different meaning from elevated particles that remain high while the room is occupied and the HVAC fan runs. A recurring rise in CO2 during the same evening period may point toward ventilation performance, even if particle readings remain low. Look for repeated timing, not the most alarming point on the screen.
Read each metric in context
PM2.5 needs averaging and source interpretation. WHO guidance identifies 15 micrograms per cubic meter as the guideline value for a 24-hour mean, while short sensor peaks should trigger source investigation rather than automatic conclusions about long-term health risks, as set out in the WHO air-quality guidance. A short peak during frying may call for source control and ventilation. A repeated high baseline may justify inspection of filtration, outdoor-air pathways, combustion sources, or dust reservoirs.
CO2 should be used as a ventilation diagnostic, not an overall IAQ score. Rising CO2 during occupancy can indicate insufficient outdoor-air delivery, but it doesn't detect PM2.5, VOCs, radon, carbon monoxide, or pathogens. Check the reading against room use, doors, windows, fan schedules, and outdoor conditions.
Temperature and relative humidity help explain comfort complaints and moisture risk. If humidity rises alongside odors or condensation, investigate the building envelope, plumbing, bathrooms, basement, and HVAC condensate management rather than treating the monitor as a mold detector.
A home air-quality meter can make the data easier to view, but the display doesn't remove the need for notes and quality control. Use this indoor air quality meter guidance to understand the role of consumer instruments, then preserve the original data for comparison after any intervention.
Separate a source event from a building condition
Ask four questions for every unusual pattern:
Does it repeat? Repeated peaks at the same time suggest a recurring activity or operating condition.
Does it follow occupancy? A CO2 rise during occupancy supports a ventilation investigation.
Does it track outdoor air? Indoor PM2.5 that follows outdoor smoke may indicate infiltration.
Does it respond to an intervention? A documented change in filtration, fan operation, or source control should produce a measurable and repeatable difference if it addressed the cause.
When the pattern remains unclear, don't compensate by buying more gadgets. Improve the sampling plan or move to a collocated, calibrated, or laboratory method.
Taking Action Based on Your Measurement Results
Measurement is useful only when it changes what you do next. If the data shows a source event, control the source first. If particles enter during outdoor smoke, review filtration, outdoor-air dampers, economizer operation, and return-air pathways. If CO2 rises with occupancy, have the ventilation system evaluated rather than assuming a stronger particle filter will solve the problem.
Start with actions that match the pollutant:
Particles: Inspect filter fit and condition, reduce indoor combustion and cooking emissions, and evaluate filtration capacity with an HVAC professional.
Ventilation: Check outdoor-air delivery, fan schedules, dampers, and system balance. CO2 data can help identify the timing of the problem, but a technician must assess the equipment.
Moisture: Find and correct the water source before treating an odor. Inspect condensation, drainage, leaks, bathrooms, basements, and coil or drain-pan conditions.
Chemicals: Remove or isolate the emitting product where practical, increase appropriate ventilation, and use laboratory sampling when the identity or concentration matters.
CO and radon: Use the dedicated safety and radioactive-gas testing pathways described earlier. These aren't problems to diagnose with a general-purpose monitor.
Professional duct and HVAC work makes sense when debris, coil contamination, airflow problems, moisture, or persistent readings point to the mechanical system. Duct cleaning isn't a universal answer to every symptom, but it can be relevant when inspection identifies accumulated material that the system is distributing. Coil cleaning, filter evaluation, and airflow checks may be more appropriate when the data points to equipment performance.
For a structured evaluation, residential indoor air quality services can be one route to professional diagnostics and targeted corrective work. Advanced air-cleaning systems, including NASA-certified ActivePure installations, may also be considered for specific persistent biological or chemical concerns, but they should complement source control, ventilation, filtration, and moisture correction. No purifier can repair a leaking roof, a backdrafting combustion appliance, or a poorly operating outdoor-air damper.
Stop DIY testing when the result could affect a major HVAC purchase, remediation decision, property transaction, or health-related concern. At that point, ask for documented methods, instrument details, sampling locations, raw data, laboratory procedures where applicable, and a clear explanation of uncertainty.
Purified Air Duct Cleaning provides residential and commercial indoor air-quality support across the Phoenix metropolitan area, including air duct cleaning, dryer vent cleaning, HVAC coil cleaning, and installation of ActivePure air-purification systems. Visit Purified Air Duct Cleaning to request a quote and discuss testing results with a technician who can connect the readings to practical HVAC and source-control steps.